Stitching the Sky at Sea

by Laura Guertin (TAS, 2014 & 2023)
We are surrounded with Earth Science data, some right before our very eyes. In fact, we are able to observe and collect data from our atmosphere easily and without any scientific equipment. We don’t have to look far above our heads to see incredible cloud formations, the distribution of clouds across the sky, and variations in sky and cloud color. Students are taught in school to identify the different types of clouds (NOAA SciJinks has a great Types of Clouds resource as a reference), but there is so much more data we can explore—and document through the creative arts!
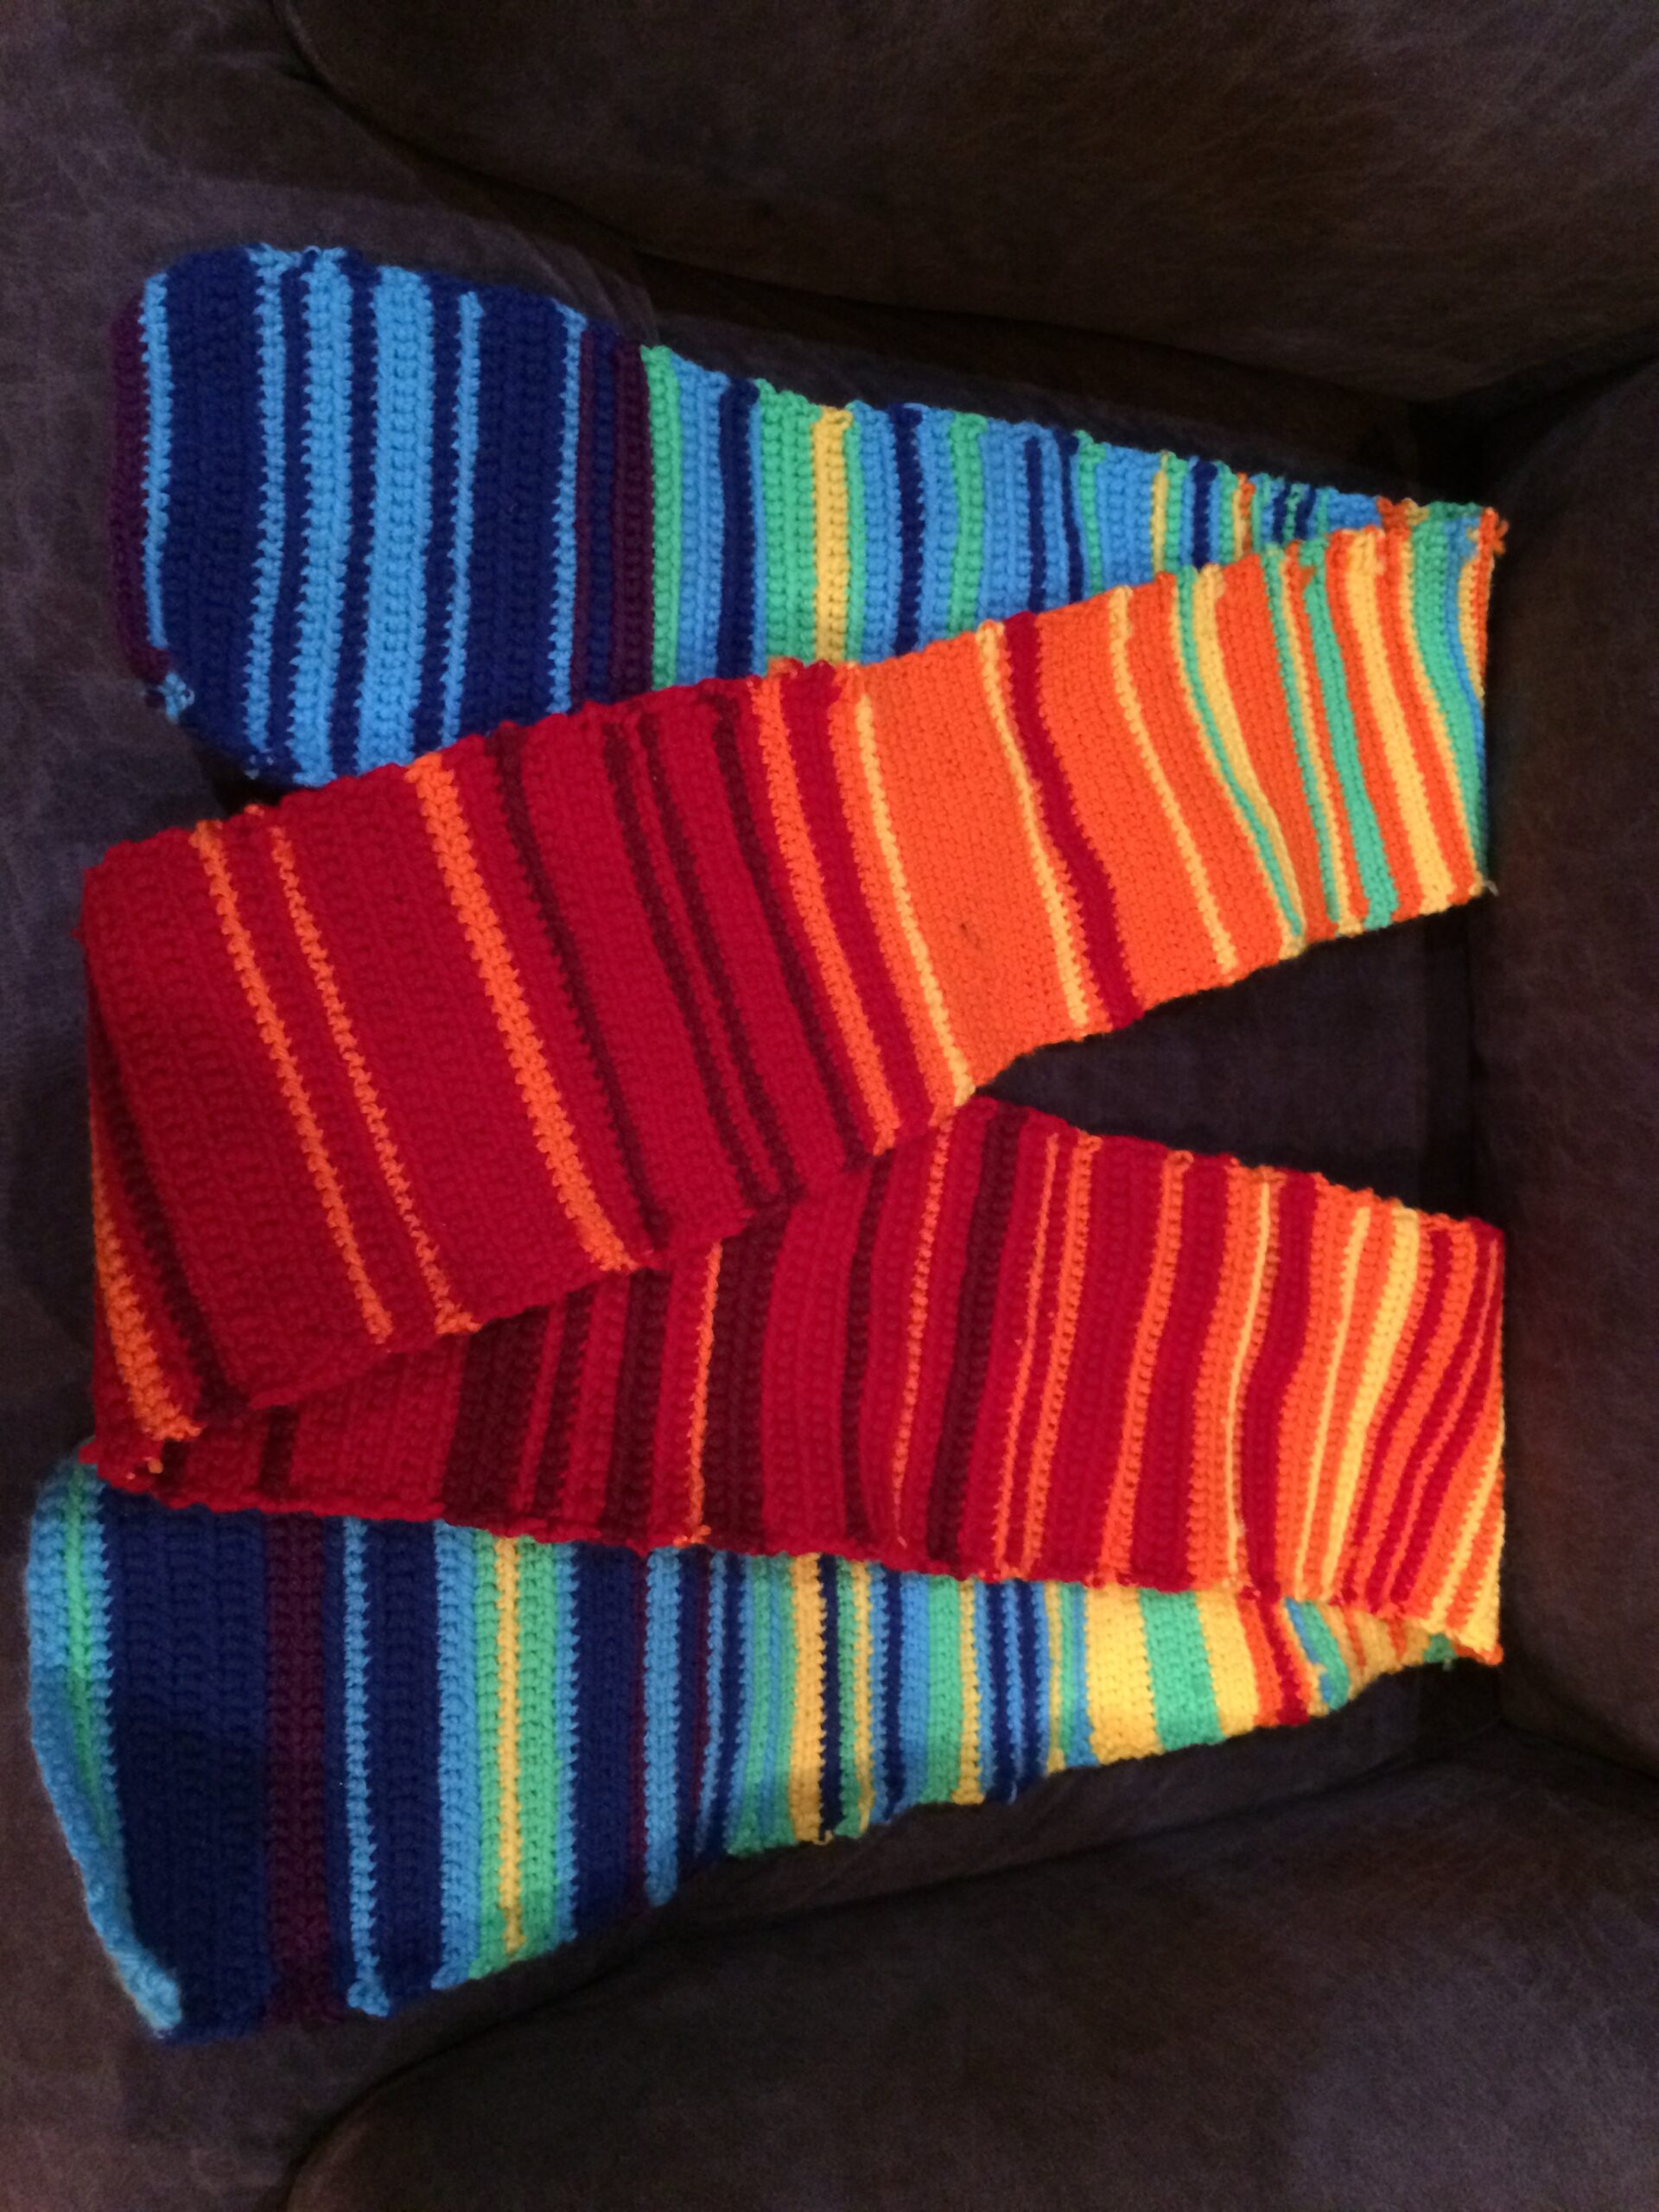
You may already be familiar with science, technology, engineering, art, and mathematics (STEAM) projects that involve knitted and crocheted scientific data, such as those that illustrate daily temperature data or temperature anomalies. The image to the right depicts a crocheted scarf of the one-year record of daily maximum temperatures for Philadelphia, Pennsylvania in 2014. Click here to learn how you can stitch your own temperature record.
I am about to head out on NOAA Ship Oscar Dyson (June 7 – 22, 2023) for the first leg of the Gulf of Alaska Walleye Pollock Acoustic Trawl Survey. I will be looking to the sky to record my observations in what I’m calling the Stitch the Sky Project.
I invite you to join me and make your own local atmospheric observations and “stitch” them with your favorite tool (knitting needle, crochet hook, embroidery needle, or if “stitching” isn’t your thing— colored felt strips, construction paper, drawing, or painting). Read on to learn how!
Stitch the Sky - Color Observations
My Stitch the Sky Project is based upon the Knit the Sky Scarf Project, which encourages individuals to look at the sky for one year and knit a row each day in a color of yarn that represents the color of that day’s sky. My plan is to make daily observations, ideally at the same time of day, and note the sky color. I’ll also take a photo, so I have a record of the observation. These daily observations will be uploaded into one post on my TAS blog that I’ll revisit and update each day while I’m at sea.
Then, I will crochet a row in the color of yarn I brought with me that most closely matches what I see. I won’t be out long enough to generate an entire scarf, but I’ll stitch several rows so that by the end, I’ll have a potholder, or mini table runner, or a small wall hanging—something fun that documents my observations.
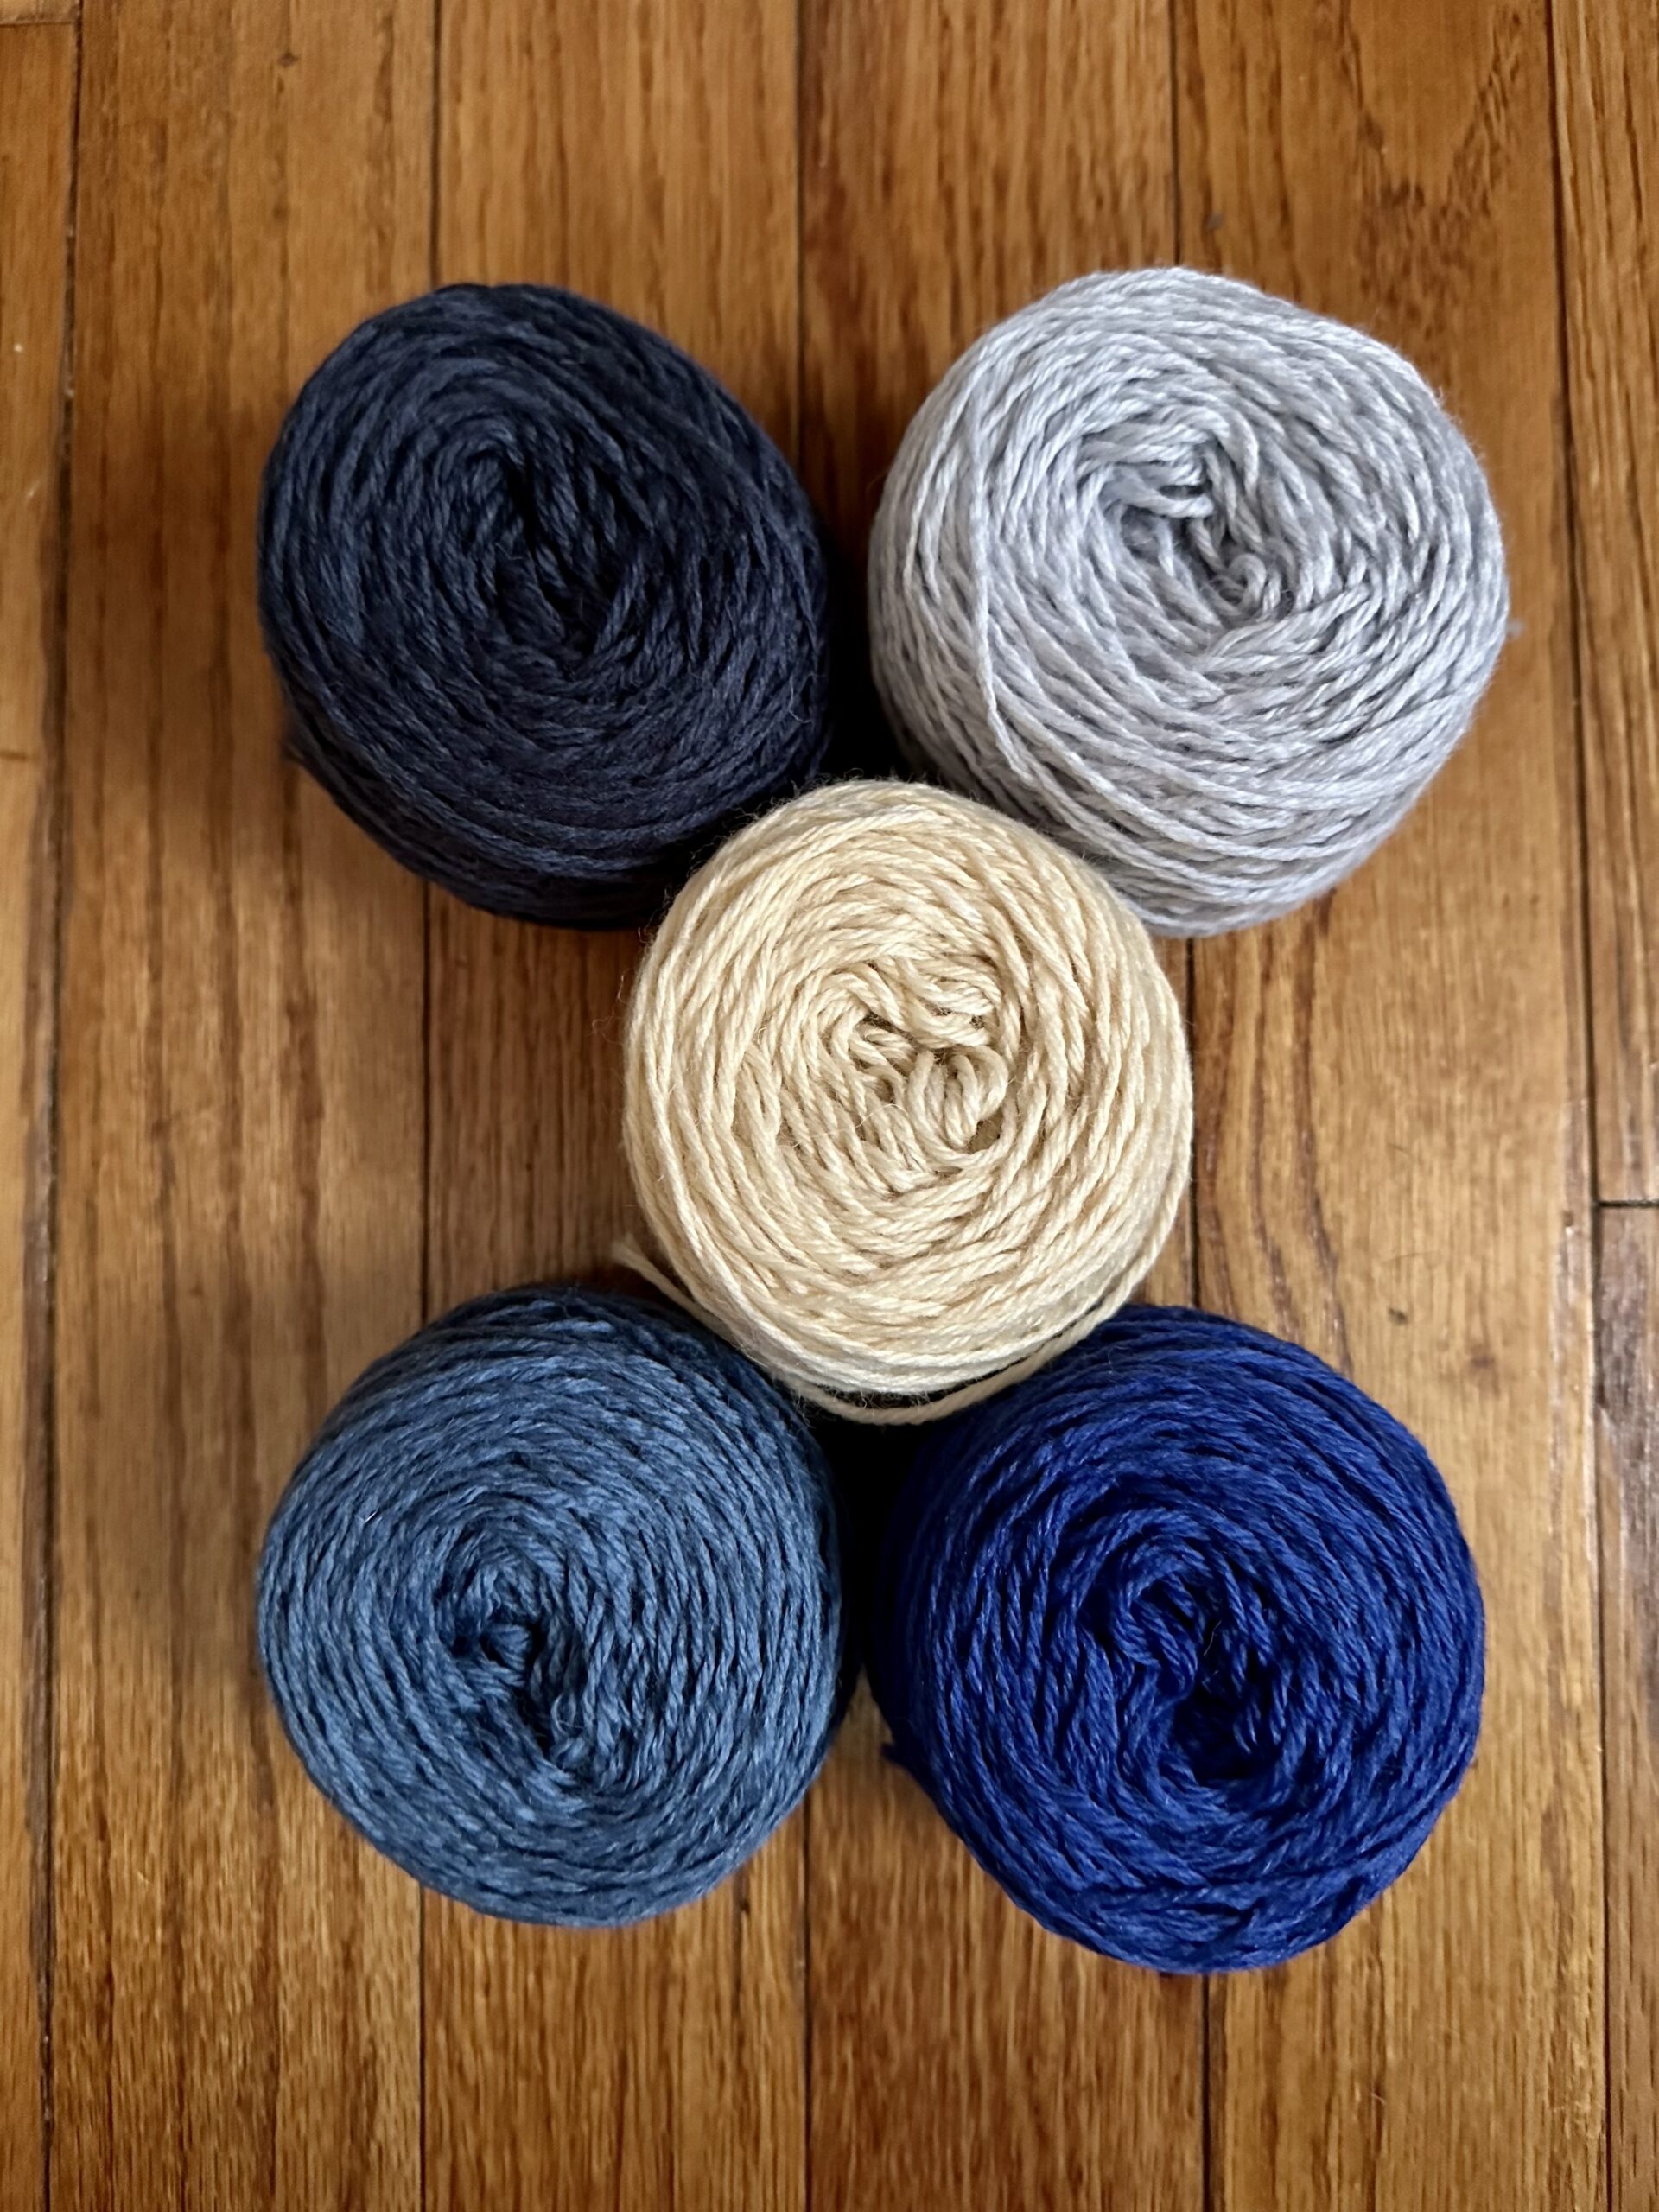
Which colors will I use? The Knit the Sky Scarf Project recommends picking five colors as the basis for the stitching. Strands of two different colors can be stitched together to provide additional color options. To represent the blue-to-gray skies I’ll observe, I am using the following yarn colors available from The Tempestry Project: Aurora, Downpour, Cumulus, Albedo, Nebula. I am a fan of these earthy colors, but any color combination can be used.
I hope others will follow along and stitch the sky color from their location during the same dates I’m at sea—it would be fun to compare our stitches when I return from the Gulf of Alaska!
Variations for Stitch the Sky
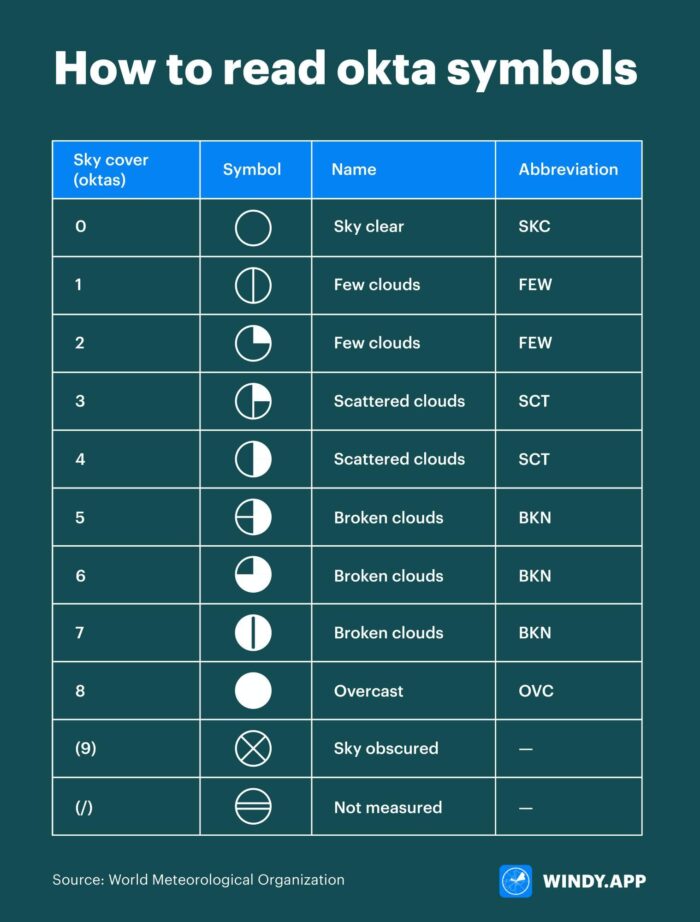
Recording the daily variations in the color of the sky is one way to make regular observations of our surroundings. In addition to making sky color observations, scientists also record a value called cloud cover, sometimes called cloud amount. This is defined as the fraction of the sky covered by cloud of any type or height above the ground. It is measured on the okta scale that starts at zero for a clear sky and extends to 8 for a sky that is completely overcast.
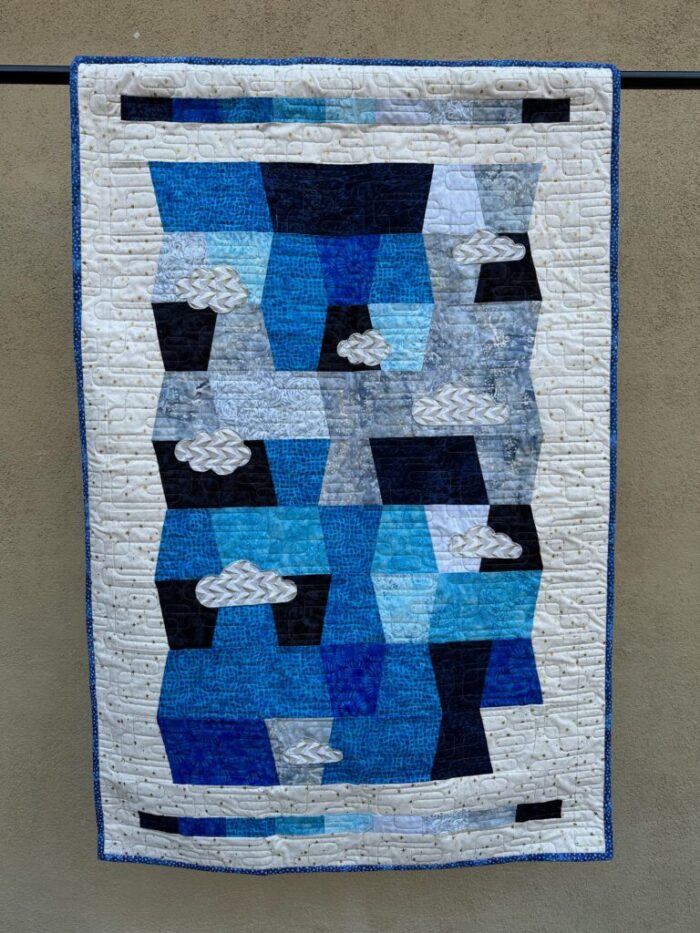
I created a quilt called “Blue Skies and Cloud Cover” with two months of the okta values recorded by the bridge crew on JOIDES Resolution in 2022, while we were in the South Atlantic Ocean.
Another way to stitch quantitative measurements of sky cover is by diving into the National Weather Service (NWS) Climate Information portal. Here is an example of how I’d do this. You can change the location to wherever is relevant for you.
- Go to https://www.weather.gov/wrh/climate
- Click on the state of Alaska (Be sure to click on the lower portion, the Anchorage region). [See Figure 1]
- On the next page, select the tab “Observed Weather” > “Daily Climate Report (CLI)” > then the location “Kodiak” (as my ship is departing from Kodiak Island). [See Figure 2]
- A table then appears at the bottom of the page listing SKY COVER for the previous day. NWS reports this average value in tenths on a scale of 0.0 to 1.0. On this scale, 0.0 indicates a clear sky and 1.0 (or 10/10) indicates a completely covered sky. I can also go back to previous dates to see what the Sky Cover values were, in addition to weather data. [See Figure 3]


So much data! So many options to pursue! As I want to make sure I spend some time looking at my surroundings, I’ll be using my own observations of the color of the sky each day for my stitching project. If you are doing this project with students, you could have them go out and observe their local sky cover and then go inside and look up what the National Weather Service has recorded. There are a lot of options here!
In the end…
By sharing this project, I hope that others will join me as participants and will become active observers in the world around them and learn more about the atmosphere and overall Earth systems. When I return, I look forward to sharing my work with new, non-STEM audiences (like stitching groups) that do not typically engage with science information or ocean exploration. Three cheers for promoting ocean and science literacy where you least expect it!
If there are any questions about the Stitch the Sky Project, or if you have stitching you would like to share, please do not hesitate to contact me (guertin@psu.edu)!
Note from TASAA: If you follow along with Laura or do this project another time, we would love to see your creations on our private Facebook page! Please share!
For those interested in learning more about clouds and exploring additional resources, you can visit these sites for information:
- NWS Clouds (Introduction) and NWS Cloud Chart (National Weather Service)
- NOAA Cloudwise/Weatherwise Poster (National Weather Service)
- Types of Clouds and Articles (NOAA National Environmental Satellite Data and Information Service)
- How we measure cloud (Met Office)
- mPING app (NOAA National Severe Storms Laboratory)

Laura Guertin sailed as a Teacher at Sea in 2014 on NOAA ship Thomas Jefferson on Hydrographic Survey of the North Atlantic Ocean. She is also about to head out on NOAA Ship Oscar Dyson (May 31-June 22, 2023) for the first leg of the Gulf of Alaska Walleye Pollock Acoustic Trawl Survey.